Graphing Relations, Domain, and Range
Graphing Relations, Domain, and Range
A relation is just a relationship between sets of information. When x and y values are linked in an equation or inequality, they are related; hence, they represent a relation.
Not all relations are functions. A function states that given an x, we get one and only one y.
| y = 3x + 1 | x2 + y2 = 5 |
| This is a function. For any value of x you plug in, you will get only one possible value for y. For example, if x = 2, y can only equal 7. | This is not a function. Any value of x can give you more than one possible y. For example, if x = 1, y could equal 2 or −2. |
It is possible to test a graph to see if it represents a function by using the vertical line test. Given the graph of a relation, if you can draw a vertical line that crosses the graph in more than one place, then the relation is not a function.
 |  |
| This is a function. Any vertical line will cross this graph at only one point. | This is not a function. There is a vertical line that will cross this graph at more than one point. |
The domain is defined as all the possible input values (usually x) which allow the formula to work. Note that values that cause a denominator to be zero, which makes the function undefined, are not allowable values.
- The function y = 4x2 − 9 has a domain of all real numbers, which can be expressed using the interval (−∞, ∞). Every possible x-value will give you a legitimate y-value.
- The function has a domain of all real numbers except −5, because when x = −5, the denominator will be zero, and the function will be undefined. We can express this using the inequality x ≠ −5, or the interval (−∞, −5) ⋃ (−5, ∞).
The range is the set of all possible output values (usually y), which result from using the formula.

Practice
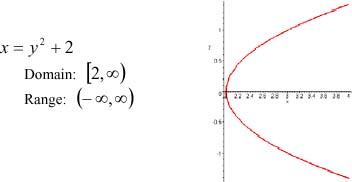
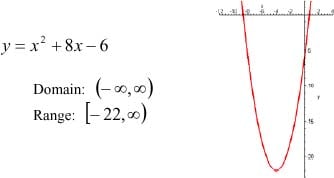
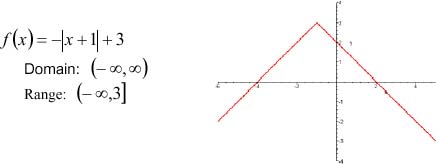
For each relation, state if it is a function. State the domain and range, and sketch a graph.
1.
2.
3.
4.
5.
Answer Key
1. Not a function

2. Function

3. Function

4. Function

5. Function
