Learning Target: I can represent ratios using models.
 Learning Target: I can represent ratios using models.
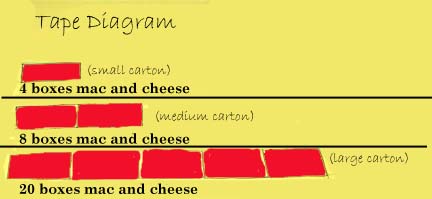
Stella's mother shops at a grocery store that sells bulk products. She can buy macaroni and cheese in a small carton of 4 boxes, medium carton of 8 boxes or large carton of 20 boxes.
Stella uses a tape diagram to represent these quantities.
If the small carton of macaroni & cheese costs $3.50, and the rate of cost remains constant, how much will the large carton of mac & cheese cost?
Think --
The diagram shows that the large carton is 5 times as large as the small carton. If the rate of the cost remains constant, the large carton will cost 5 times as much as the small carton.
Solve --
5 × $3.50 = $16.50
If a customer needed 40 bars of soap, how many packages would need to be purchased?
Based on this information, how far would he travel using 6 gallons of gas?
A. The average student to teacher ratio is lower for grade 5.
B. The average student to teacher ratio is lower for grade 6.
C. The student to teacher ratios for grades 5 and 6 are the same.
D. Since class sizes vary per grade, it is impossible to find the average ratio.
Graph the relationship between time and distance on the coordinate plane below.
Assuming a consistent rate, how far had Elijah walked after 2 hours?