
Let's use data in a pictograph!

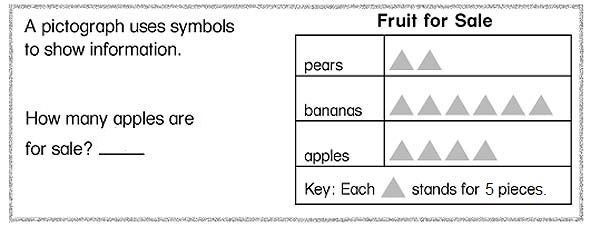
First, look at how many items each symbol means.
In this case, each triangle means 5 pieces of fruit.
Then, count the number of symbols for the apples.
There are 4 triangles for the apples.
Use skip-counting to find the total number of apples.
Each triangle means 5, so skip-count by 5s.
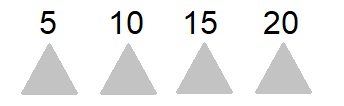
Answer:
There are 20 apples for sale.

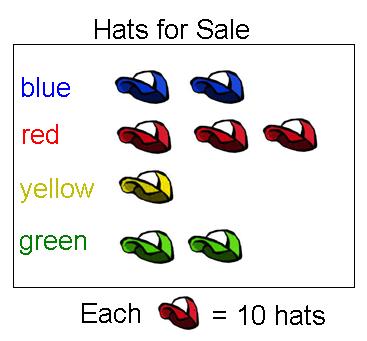 Use the information in the pictograph to answer the questions.
1. How many red hats are for sale?
2. How many green hats are for sale?
3. How many green hats and yellow hats are for sale?
4. How many more blue hats than yellow hats are for sale?
5. Which two colors of hats have the same number for sale?
6. What is the total number of hats for sale?
Use the table to draw your own pictograph. Draw 1  for every two sport balls. Then answer the questions below.


10. How many more tennis balls are there than soccer balls?
11. If 2 baseballs get lost, how many  do you take away?
Answers
1. 30
2. 20
3. 30
4. 10
5. blue and green
6. 80
7.
8.
9.
10. 2
11. 1