Learning Target: I can compute and interpret the measures of variation for a set of data.
 Learning Target: I can compute and interpret the measures of variation for a set of data.
Measures of Variation
Measures of variation are used to describe the distribution or spread of data.
Range
The range is the difference between the greatest and least data values.
Quartiles
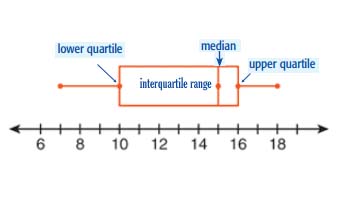
Quartiles are values that divide the data set into four equal parts.
The median divides the data in half.
Then, the lower quartile is the section of data from the lowest value to the median of the lower half.
The upper quartile is the section of data from the highest value to the median of the higher half.
Half of the data will reside in the interquartile range.
Mean Absolute Deviation (MAD)
The mean absolute deviation is the average distance between each data value and the mean. This value tells how spread out the data is relative to the mean.
Example
Consider the data shown below. Identify the range. Display and describe the quartiles and find the mean absolute deviation.
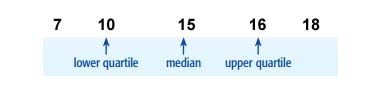
7, 10, 15, 16, 18
Range
The range of the data is 18 − 7 = 11.
Quartiles
The median is 15.
The lower quartile is 10.
The upper quartile is 16.
The interquartile range is between 10 and 16, which can also be represented by the number 6 (16 − 10 = 6).
Mean Absolute Deviation
The mean is 13.2.
Each data point has the following distances from the mean:
13.2 − 7 = 6.2
13.2 − 10 = 3.2
15 − 13.2 = 1.8
16 − 13.2 = 2.8
18 − 13.2 = 4.8
The average of these distances is: 3.76
Mean Absolute Deviation = 3.76
Let's Practice Together
The five-number summary for a set of data is shown below.
12, 16, 25, 27, 30
1. Find the range.
2. Find the interquartile range.
3. If these were the only five numbers in the set, what would the mean absolute deviation be?
Your Turn
Consider the data shown below. Display and describe the quartiles and find the mean absolute deviation.
4. Compute the range.
5. Find the quartiles.
6. Find the mean absolute deviation.
Check for Understanding
1. This is a set of 10 scores from a recent exam.
85, 92, 88, 95, 78, 84, 91, 75, 85, 89
Compute the range, interquartile range, and mean absolute deviation.
Answers
1. 18
2. 11
3. 6.4
4. 5
5. Lower Quartile: 1; Median: 2; Upper Quartile: 3.5
6. about 1.42
Check for Understanding
1. Range: 20; IQR: 7; MAD: 4.8